Technical information on strain gages
Transducers utilizing strain gages enable a wide range of applications, including electrical measurement, remote indication, recording, and control of load, pressure, torque, acceleration, and more. These applications span from research and industrial fields like machinery, ships, airplanes, civil engineering, and construction to commercial areas such as scales and household uses like weight scales.
Since we first manufactured strain gages in 1952, we have been developing our mass production technology overseas as a strain gage manufacturer, and manufacturing stable quality strain gages in addition to our tremendous supply capacity.
- Characteristics of strain gages
- Names of each part of the strain gage
- Principle of strain gage
- Principle of self-temperature compensation
- Measurement of strain gage
- Measurement example using strain gage
- Correction of gage factor
- Applied voltage of strain gage
- Physical properties of various general materials
Characteristics of strain gages

The material and grid shape of the strain gage are designed in consideration of fatigue resistance, and it can be used not only for static strain measurement that requires stability but also for dynamic strain measurement that requires fatigue resistance.
All types have self-temperature compensation, and can be used in a wide temperature range for objects to be measured with various thermal expansion coefficients.
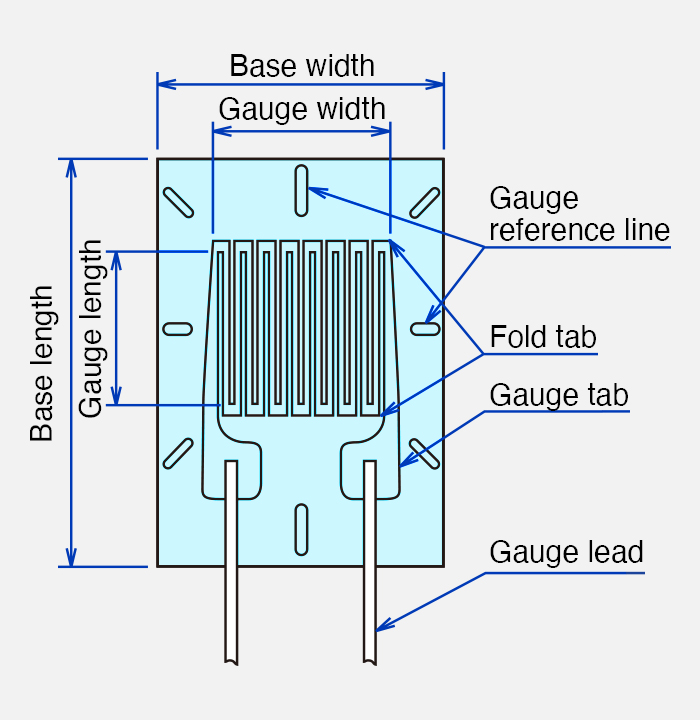
Names of each part of the strain gage
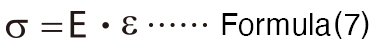
Principle of strain gage
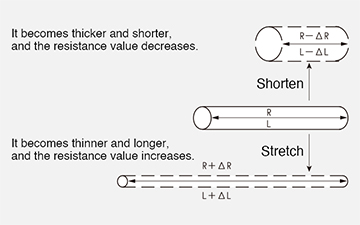
The resistance value of a metal resistor changes when it expands or contracts.
In order to utilize this principle, the strain gage is made by printing a pattern like the above figure on a metal resistor about 5 μm thick and etching it. Here, the strain ε is defined in formula (1) by dividing ΔL by L.
Furthermore, formula (2) holds between the resistance value R, which changes with strain.
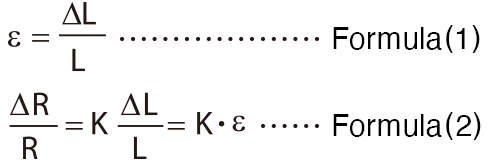
K is called the gage factor and is a proportional constant that represents the sensitivity of the strain gage. This gage factor varies depending on the material of the metal resistor, constantan (copper, nickel alloy), which is generally widely used for strain gages, shows approximately 2.
Principle of self-temperature compensation
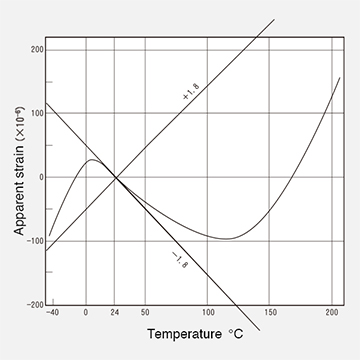
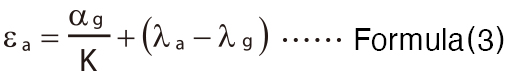
When the strain gage is adhered to the object to be measured, an apparent strain due to temperature appears due to the difference between the linear expansion coefficient (λg = 15.5 × 10 −6 /℃) of the metal resistor of the strain gage and the linear expansion coefficient of the object to be measured (for example, aluminum λa = 23 × 10−6/℃). In the case of aluminum, 23−15.5=7.5×10 −6/℃, therefore, at 10/℃, it will be 75×10−6, which is a large error that cannot be ignored. The principle of self-temperature compensation is to cancel this out with the temperature resistance coefficient ( ) of the metal resistor that forms the strain gage.
At this time, the apparent strain is expressed by formula (3).
) of the metal resistor that forms the strain gage.
At this time, the apparent strain is expressed by formula (3).
Our strain gages are adjusted so that they fall within the error range of ±1.8×10 −6/℃ in a wide range up to 200 ℃ as shown in the graph on the right.
Measurement of strain gage
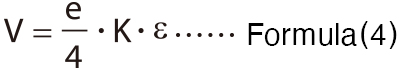
The change in resistance value due to strain in a strain gage is extremely small, and this is taken out as a voltage change using a Wheatstone bridge circuit. By using this Wheatstone bridge, it is possible to remove the apparent strain due to temperature and double the output voltage by combining strain gages.
(1) 1-gage method (2 wire type)
This is the simplest method in which a strain gage is placed on one side of the bridge. Here, since the gage leads (r1, r2) are inside the bridge, a large apparent strain that cannot be ignored appears when the gage leads are long and undergo temperature changes. The graph below shows the apparent strain of a 7/0.12 lead wire of 10 m.
(2) 1-gage method (3 wire type)
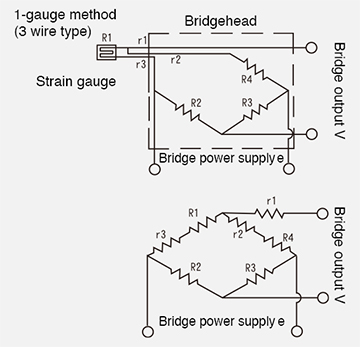
Similarly, this method involves placing a strain gage on one side of the bridge. However, because one of the gage leads is connected to an adjacent side, the apparent strain caused by temperature changes in the gage leads is canceled out within the bridge by r2 and r3, and therefore does not appear. (Please refer to the graph below.)
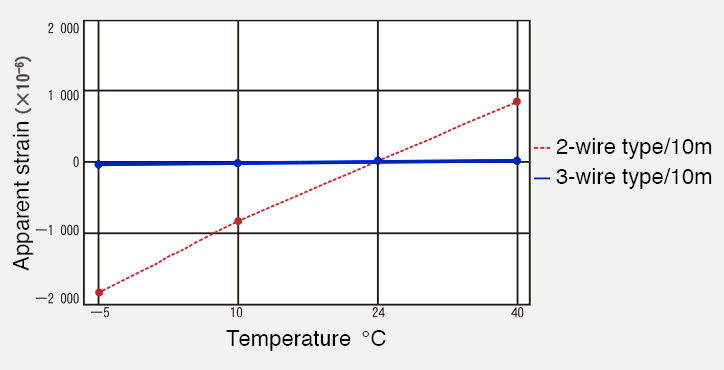
Apparent strain due to lead wire
(3) 2-gage method (half bridge)
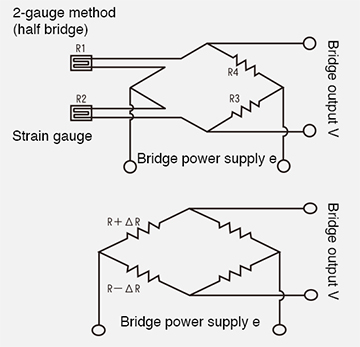
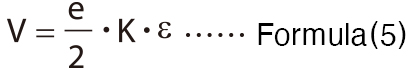
Each strain gage is self-temperature compensated according to the linear expansion coefficient of the material to be measured, but the apparent strain due to temperature can be further reduced by using strain gages on adjacent sides of the bridge. Also, if two gages are arranged to receive strains of opposite signs, it is possible to obtain twice the output of the maximum 1-gage method, as shown in formula (5).
(4) 4-gage method (full bridge)
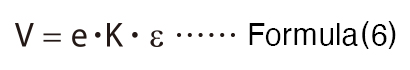
Temperature compensation can be achieved using the same principle as the 2-gage method, and an output four times that of the 1-gage method can be obtained, as shown in formula (6).
Measurement example using strain gage
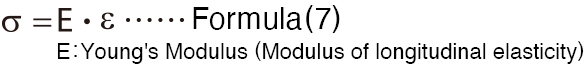
(1) Tensile/compressive stress
1-gage method
The stress σ of a round bar as shown in the right figure is obtained by the following formula.
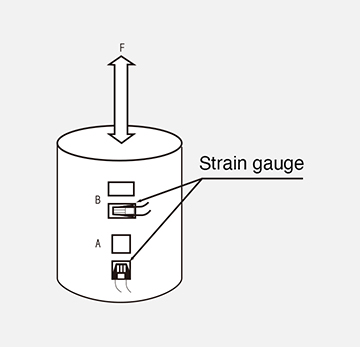
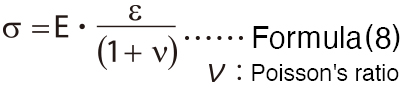
2-gage method
If the strain gage B is applied as shown in the figure on the right, the amount of strain will increase by Poisson's ratio. Therefore, the stress σ can be obtained from the combined strain ε of the strain gages A and B by the following formula.
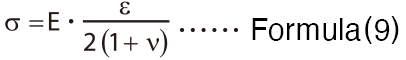
4-gage method
If bending stress is expected in addition to tensile compression, bending strain can be eliminated by adding another pair of strain gages A and B to the opposite side of the column to make a 4-gage method. In this case, the stress δ is determined from the strain ε for the four strain gages.
(2) Bending stress
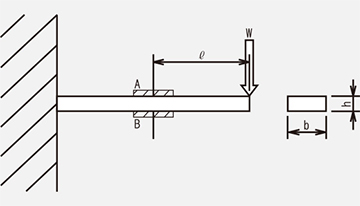
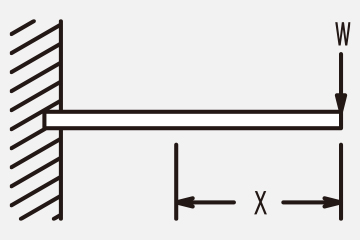
1-gage method
Similar to tensile/compressive stress, the stress σ at the gage attachment point can be obtained from the strain ε of the strain gage A of the cantilever as shown in the right figure by the following formula.
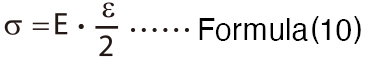
2-gage method
The amount of strain is doubled by A and B. Therefore, the stress σ at the gage attachment point can be obtained from the strain ε by the following formula.
On the other hand, the bending stress can be obtained from the following formula by calculation.
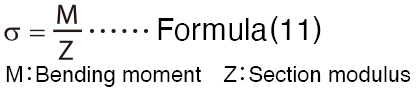
Next, typical bending moments and section modulus are shown.
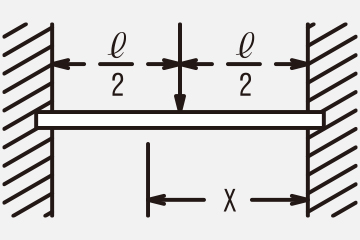
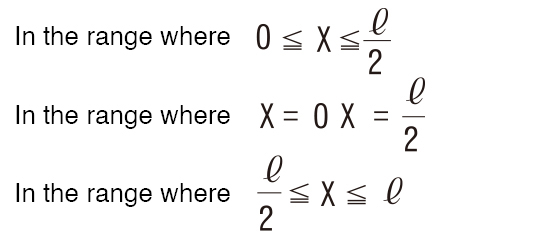
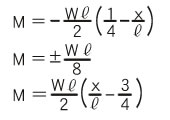
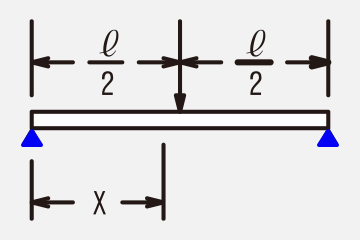
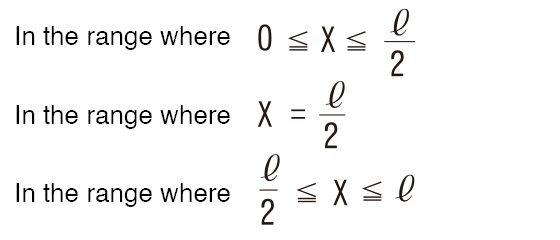
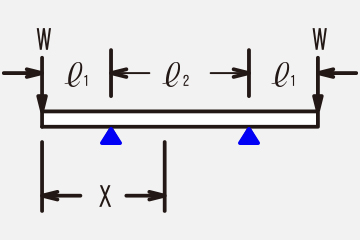
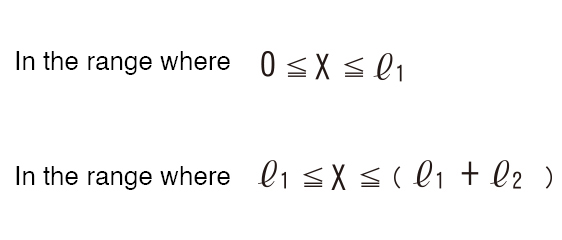
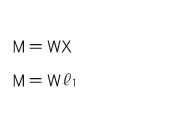
≪Example of bending moment≫
|
Model
|
Condition
|
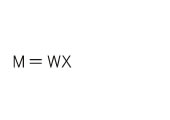
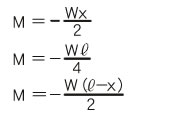
Bending moment M
|
|---|---|---|
|
|
|
|
|
|
|
|
|
|
|
|
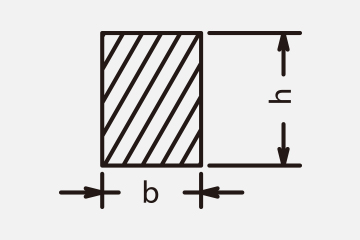
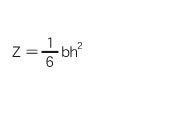
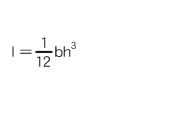
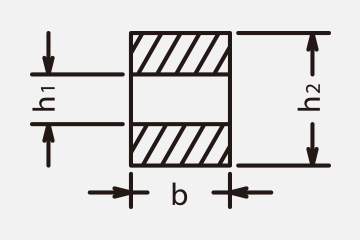
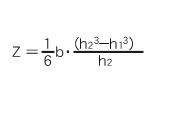
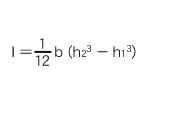
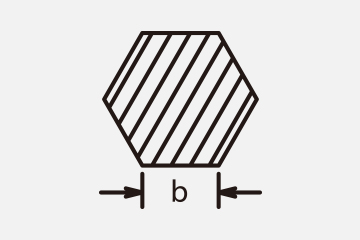
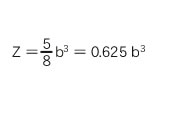
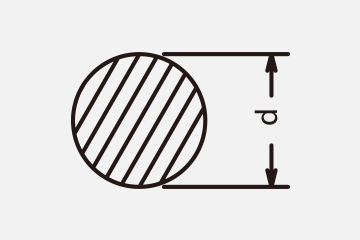
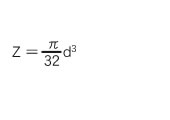
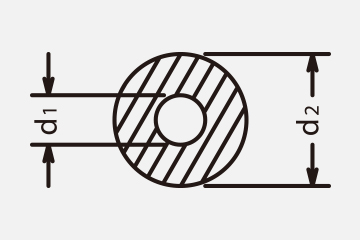
≪Section modulus≫
|
Diagram
|
Section modulus
|
Second moment of area
|
|---|---|---|
|
|
|
|
|
|
|
|

|
|
|
|
|
|
|
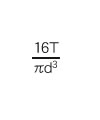
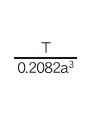
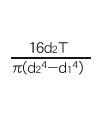
(2) Torsion of round bar
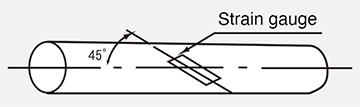
When the strain gage is attached at 45° to the center line of the round bar as shown in the above figure, the shear stress ![]() can be obtained from the strain ε due to torsion by the following formula.
can be obtained from the strain ε due to torsion by the following formula.

Conversely, the strain ε can be obtained by substituting the shear stress in the table below into formula (12).
| No. | Cross-sectional view | Shear stress |
No. | Cross-sectional view | Shear stress |
|---|---|---|---|---|---|
| 1 | 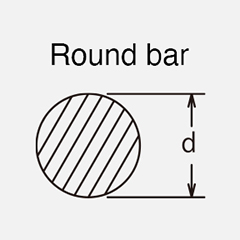
|
|
3 | 
|
|
| 2 | 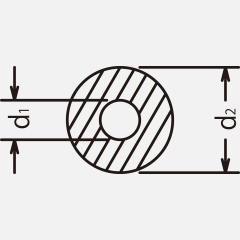
|
|
4 | 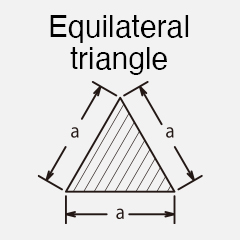
|
|
Correction of gage factor
(1) Correction of gage factor of strain gage
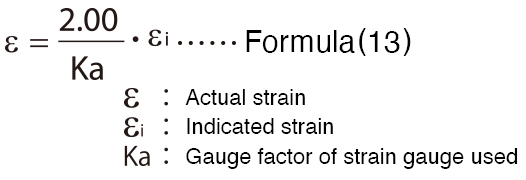
If the strain gage does not have a gage factor adjustment function and the gage factor displayed on the strain gage label is different, please correct it using the formula on the right.
(2) Correction of gage factor when lead wires are long
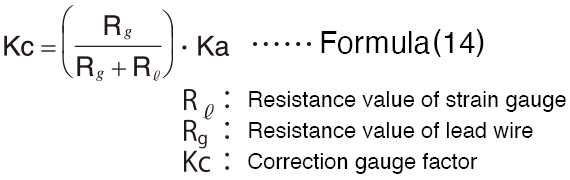
If the lead wires of the gage are long, their resistance value will be included in the Wheatstone bridge, and the gage factor will decrease. Please correct with the formula on the right. The gage factor including the vinyl wire is displayed on the label of our strain gage with vinyl wire.
≪Resistance value of lead wire≫
|
Type
|
AWG
|
Cross-sectional area(mm2)
|
Composition(number of wires/diameter)
|
Resistance value(Ω/m round trip)
|
|---|---|---|---|---|
|
Single wire
|
32
|
0.032
|
1 / 0.20
|
1.15
|
|
- ” -
|
30
|
0.051
|
1 / 0.25
|
0.74
|
|
Stranded wire
|
-
|
0.08
|
7 / 0.12
|
0.45
|
|
- ” -
|
-
|
0.11
|
10 / 0.12
|
0.31
|
|
- ” -
|
-
|
0.3
|
12 / 0.18
|
0.12
|
Applied voltage of strain gage
When current flows through the strain gage, it self-heats, causing temperature drift, which affects measurement accuracy. Therefore, the voltage applied to the strain gage depends on the heat dissipation of the bonded strain gage. It is recommended that the applied voltage be set so that the amount of heat generation is less than the following stated values.
≪Reference value for calculating strain gage applied voltage≫
W/mm2(watts/grid area)
|
Copper, aluminum, etc.
|
Iron, steel, etc.
|
Stainless steel
|
|
|---|---|---|---|
|
Static strain measurement
|
0.02
|
0.01
|
0.005
|
|
Dynamic strain measurement
|
0.02
|
0.02
|
0.11
|
For example, if a 350 Ω strain gage with a 3 mm square grid is adhered to steel, it will be as follows.
Allowable calorific value W = 0.01 × 9 = 0.09 watts
From W = V2/R, 0.09 = V2/350 V = 5.6 volts
Since this voltage is the value applied to one strain ggage, if a bridge is composed of four strain gages, the voltage applied to the bridge will be twice as high, at 11.2 volts.
Physical properties of various general materials
|
Linear expansion coefficient
×10-6 |
Modulus of longitudinal elasticity
})E(GPa{kgf/cm²}) |
Modulus of transverse elasticity
G(GPa{kgf/cm²}) |
Poisson's ratio
ν |
|
|---|---|---|---|---|
|
Low carbon steel
|
11.3~11.6
|
206 {2.1×10⁶}
|
79 {0.81×10⁶}
|
0.28~0.3
|
|
Medium carbon steel
|
10.7
|
206 {2.1×10⁶}
|
82 {0.84×10⁶}
|
0.28~0.3
|
|
Nickel steel
|
13.3
|
204 {2.08×10⁶}
|
82 {0.84×10⁶}
|
0.28~0.3
|
|
Martensitic
Stainless steel |
13.3
|
200 {2.04×10⁶}
|
78 {0.8×10⁶}
|
0.28~0.3
|
|
Austenitic
Stainless steel |
17.3
|
197 {2.01×10⁶}
|
74 {0.75×10⁶}
|
0.28~0.3
|
|
Precipitation hardening type
Stainless steel |
11
|
204 {2.08×10⁶}
|
82 {0.84×10⁶}
|
0.28~0.3
|
|
Oxygen-free copper
|
17.6
|
117 {1.19×10⁶}
|
46 {0.47×10⁶}
|
0.34
|
|
Brass
|
20.6
|
103 {1.09×10⁶}
|
38 {0.39×10⁶}
|
0.34
|
|
Copper phosphate
|
18.2
|
110 {1.12×10⁶}
|
42 {0.43×10⁶}
|
0.34
|
|
Beryllium copper
|
17.1
|
129 {1.32×10⁶}
|
-
|
0.34
|
|
Nickel
|
13
|
204 {2.08×10⁶}
|
81 {0.83×10⁶}
|
-
|
|
Duralumin (A2017-T4)
|
23.4
|
69 {0.70×10⁶}
|
-
|
0.34
|
|
Extra Super Duralumin (A2024-T4)
|
23.2
|
74 {0.75×10⁶}
|
29 {0.30×10⁶}
|
0.34
|
|
Titanium
|
8.4
|
106 {1.08×10⁶}
|
44 {0.45×10⁶}
|
-
|
|
Silicon
|
5
|
108 {1.1×10⁶}
|
-
|
-
|
|
Concrete
|
11
|
29 {0.3×10⁶}
|
10 {0.1×10⁶}
|
0.1
|
|
Glass
|
9
|
59 {0.6×10⁶}
|
29 {0.3×10⁶}
|
0.25
|
|
Wood
|
5
|
9.8 {0.1×10⁶}
|
-
|
-
|
Related page
Engineering Information for Strain gage
Technical Data
Contact Us
Please click the inquiry type below according to your question. Each product / sales representative will respond to you.